
College Selection: Test Scores & Graduation Rates Spreadsheet
Are you a junior or rising senior in high school?
Are you ready to start building your list of colleges?
If so, check out this excel file that includes the test scores of students that started college in Fall 2013 and Fall 2019.
Use this list to find the 25th – 75th percentiles for the SAT/ACT scores for students enrolled in various colleges. Then find out what percentage of those students graduated 4-, 5-, and 6-years later.
This Excel document includes two worksheets:
1. Test scores and Graduation Rates for students that started college Fall 2013
2. Test Scores: Fall 2013 and Fall 2019
This free document includes the most up-to-date data available from the most reliable data source available – the National Center for Educational Statistics (NCES – IPEDS). The dataset includes the vast majority of colleges and universities with a selectivity higher than 1% (i.e., colleges/universities accepting more than 1% of the applicants).
Here’s a brief description of the two Spreadsheets included in the Excel document you are about to download.
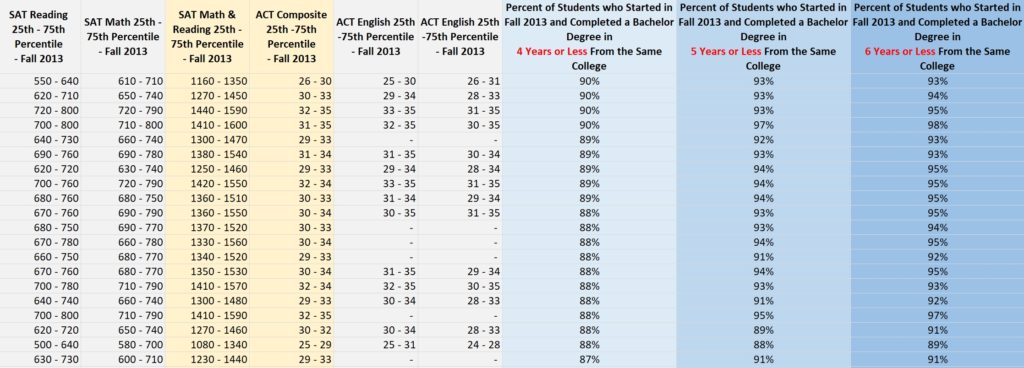
1. Test scores and Graduation Rates for students that started college Fall 2013
This worksheet includes the admission test scores and graduation rates for the students that enrolled full-time in a college or university during Fall 2013. Here are the test scores:
- the 25th percentile score for SAT Reading, SAT Math, and SAT Reading & Math
- the 75th percentile score for SAT Reading, SAT Math, and SAT Reading & Math
- the range score between the 25th – 75th percentile SAT Reading, SAT Math, and SAT Reading & Math
The same type of scores and ranges are available for the ACT.
You’ll find the 4-year, 5-year, and 6-year graduation rates for the Fall 2013 students as you scroll right. Here you can learn what percent of students that graduated high school in 2013 and enrolled full-time in college that Fall completed a bachelor’s degree from the same college 4-, 5-, or 6-years later.
2. Test scores: Fall 2013 and Fall 2019
The second spreadsheet includes a comparison of test scores for Fall 2013 and Fall 2019 that illustrates that scores have remained relatively stable over time.
Add your information below to get the Excel Spreadsheet with Test Scores and Graduation Rates.